> For the complete documentation index, see [llms.txt](https://docs.bugbug.io/llms.txt). Markdown versions of documentation pages are available by appending `.md` to page URLs; this page is available as [Markdown](https://docs.bugbug.io/debugging-tests/run-history-charts.md).
# Run history charts
## Why run history charts?
**A run of red bars in an otherwise green history is hard to miss.**
You can catch a test going flaky just by glancing at the list, instead of opening every run's logs one by one to piece together what's happening.
Each chart shows recent runs at a glance: pass or fail, and how long each one took.
{% hint style="info" %}
Only counts runs executed as part of a suite. A test run **outside** any suite doesn't appear here.
{% endhint %}
### Where you'll see it
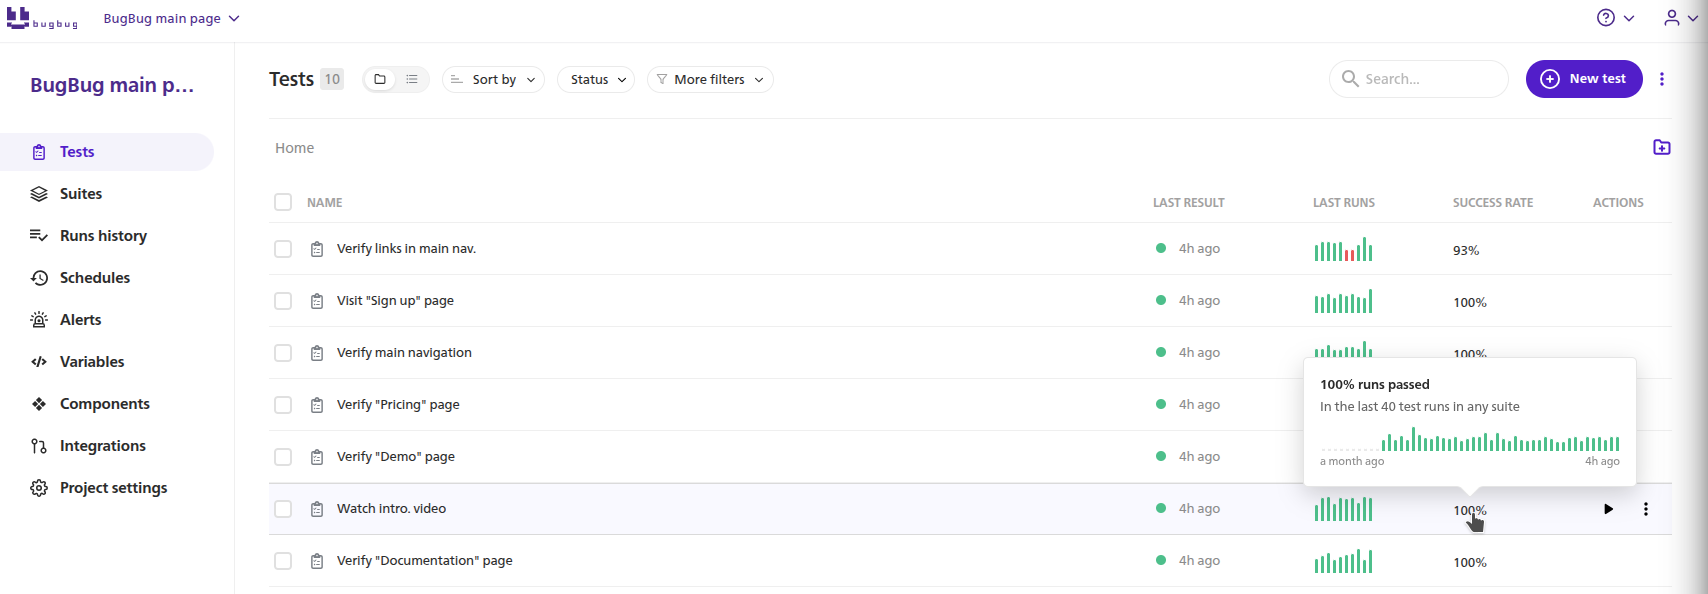
**Tests list, Suites list, and the test table inside Suite details.**
Each row shows a small bar chart of the last 10 runs - test runs on the Tests list and inside Suite details (in that suite's case, only runs from within that suite), suite runs on the Suites list.
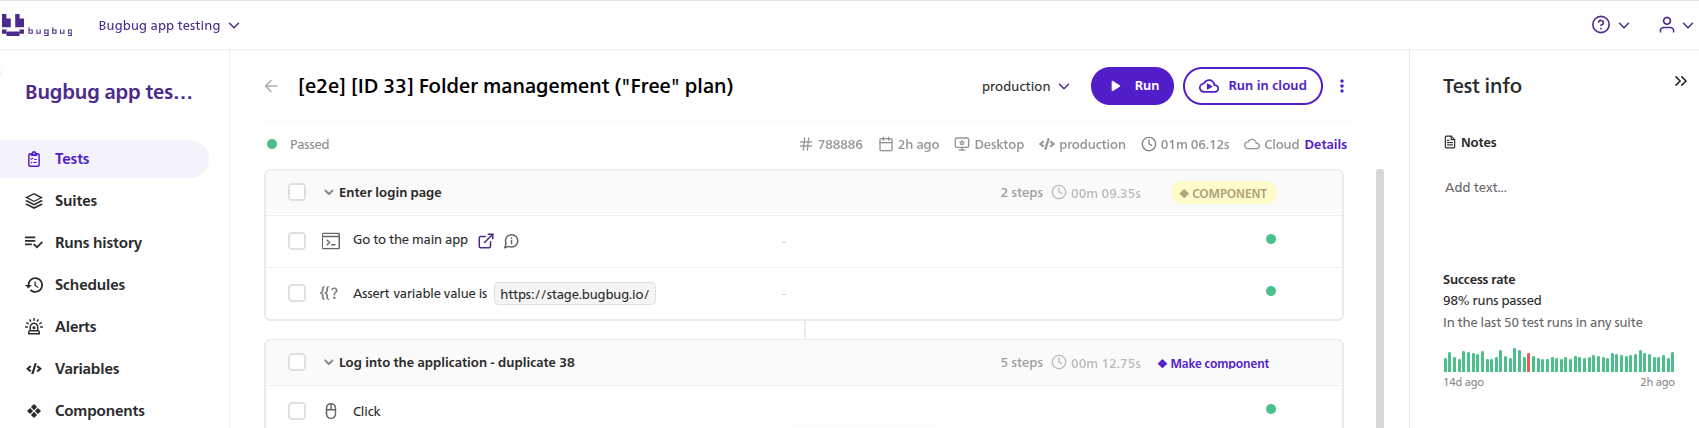
**Test details and Suite details sidebar.**
A larger, interactive chart shows up to the last 50 runs, together with a **Success rate**. The [Runs history](/debugging-tests/runs-history.md) tabs themselves don't show a chart, but opening a specific run from there lands you on this same sidebar.
### Reading a bar
Each bar is one run.
* **Height** - the run's duration. A taller bar took longer to run.
* **Color** - the run's status: green for passed, red for failed or error, with the rest of the [statuses](/running-tests/statuses.md) using the same colors you see everywhere else in BugBug (e.g. on the Runs history list).
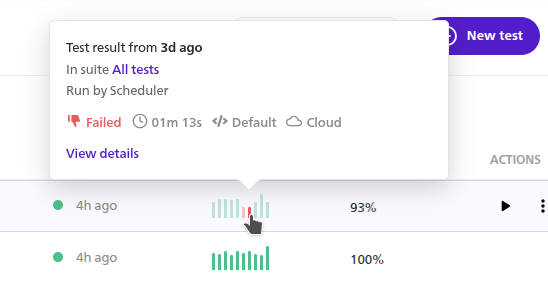
Hover over a bar to see a tooltip with the relative run time, who triggered it, status, duration, run profile, whether it ran locally or in the cloud, and a link to that run's details.
### Success rate
Next to the sparkline, the same tables show a **Success rate** column. Hover over it to open the full chart in a popover, without leaving the list - same bars, plus a link to the failed runs if there are any.
### Frequently asked questions
Why do I see fewer bars than expected, or none at all?
The chart only counts runs executed within a suite. A test or suite with little suite-run history will show fewer bars - and a test you've only ever run standalone will show none.
---
# Agent Instructions
This documentation is published with GitBook. GitBook is the documentation platform designed so that both humans and AI agents can read, navigate, and reason over technical content effectively. Learn more at gitbook.com.
## Querying This Documentation
If you need additional information that is not directly available in this page, you can query the documentation by asking a question.
Perform an HTTP GET request on the following URL with the `ask` and `goal` query parameters:
```
GET https://docs.bugbug.io/debugging-tests/run-history-charts.md?ask=&goal=
```
`ask` is the immediate question: it should be specific, self-contained, and written in natural language.
`goal` is what the user is ultimately trying to achieve, the reason they need the answer. Sharing it helps GitBook give you a better, more relevant answer. A goal is most helpful when it describes the outcome the user wants rather than restating the question. For example, with `ask=how do I create an API token`, a goal like `automate deployments from our CI pipeline` lets GitBook tailor the answer to that use case.
The response will contain a direct answer to the question and relevant excerpts and sources from the documentation.
Use this mechanism when the answer is not explicitly present in the current page, you need clarification or additional context, or you want to retrieve related documentation sections.